There's another type of Dashboard called Interactive Experience Dashboard. They are configurable, security-role based, and deliver workload information across multiple streams in real-time.
Interactive dashboard users don't need to page through the application looking for a particular record; they can act on it directly from the Dashboard.
There are two forms of Interactive Experience Dashboard:
Single-stream
Multi-stream
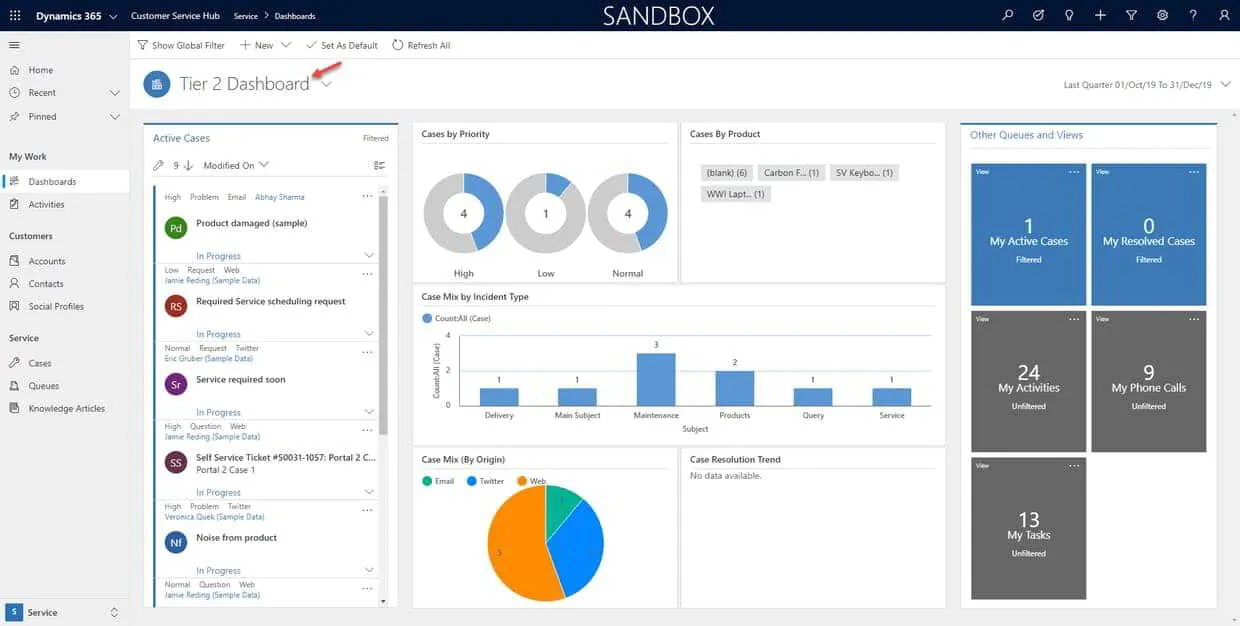
Single-steam: As the name suggests, single-stream dashboards display real-time data over one stream based on an entity view or queue.
The tiles are positioned on the right side of the dashboards and are always shown. The single-stream dashboards are typically helpful to Tier 2 service leads or managers, who monitor fewer, but more complex or escalated cases.
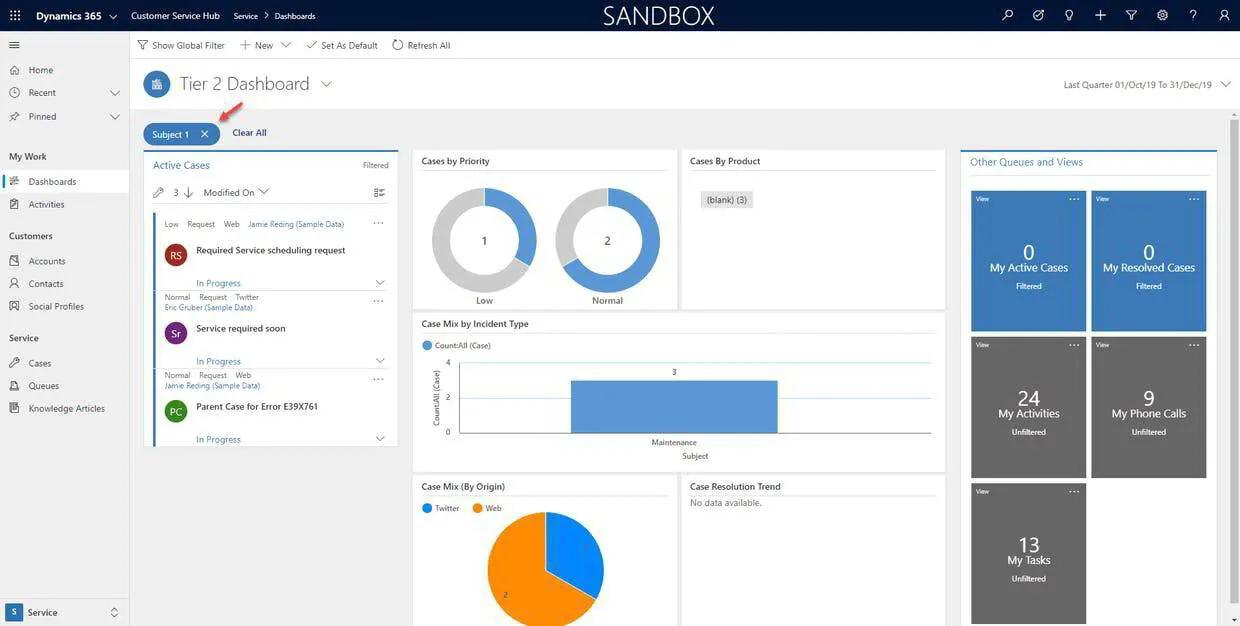
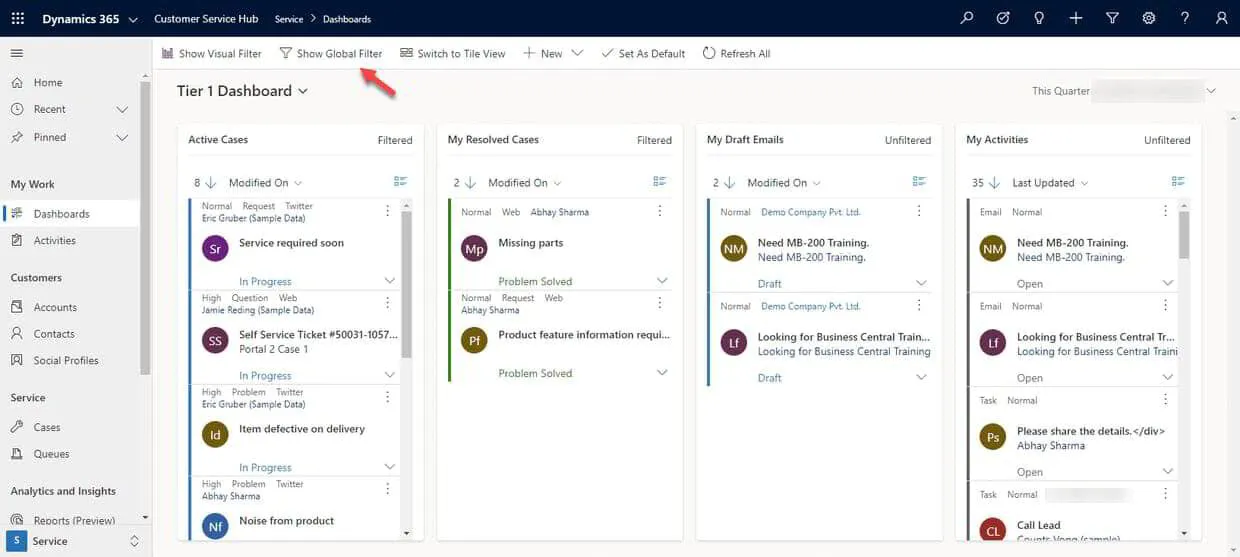
You can apply multiple filters by clicking on chart areas and also by clicking Show Global Filter just above the Dashboard name. In the below example, above Tier 2 Dashboard.
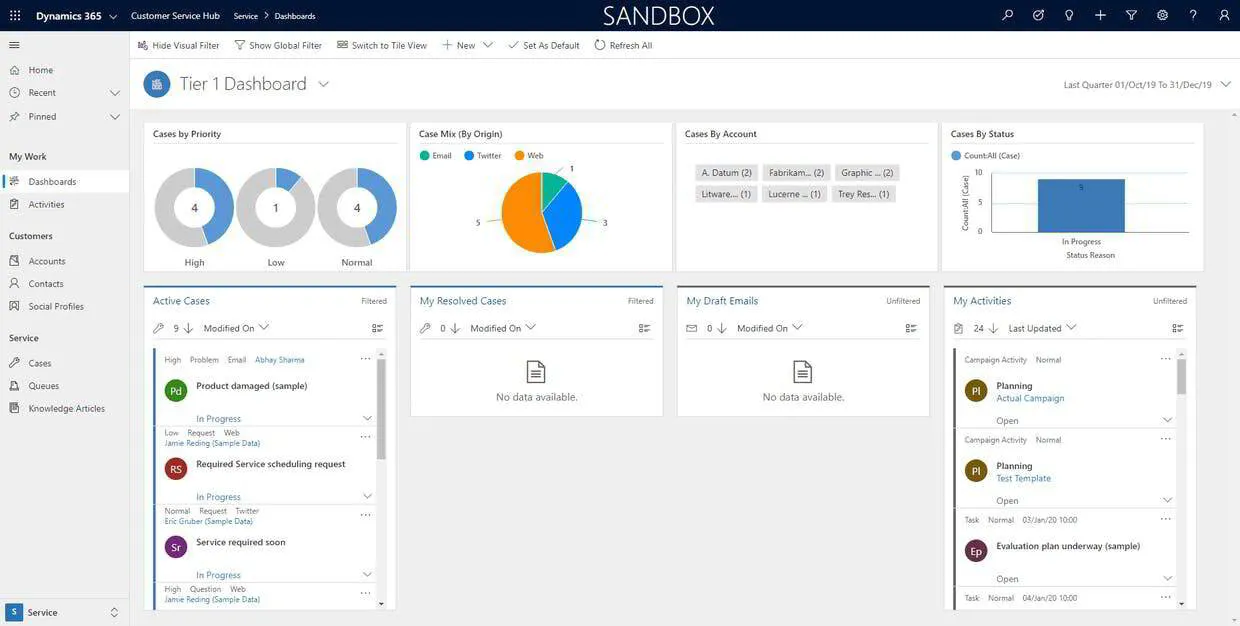
Multi-stream: The multi-stream dashboards display data in real-time over multiple data streams. Whereas in single-stream, you can have only one stream, but in multi-stream dashboards, there's no limit on how streams you can configure on a dashboard.
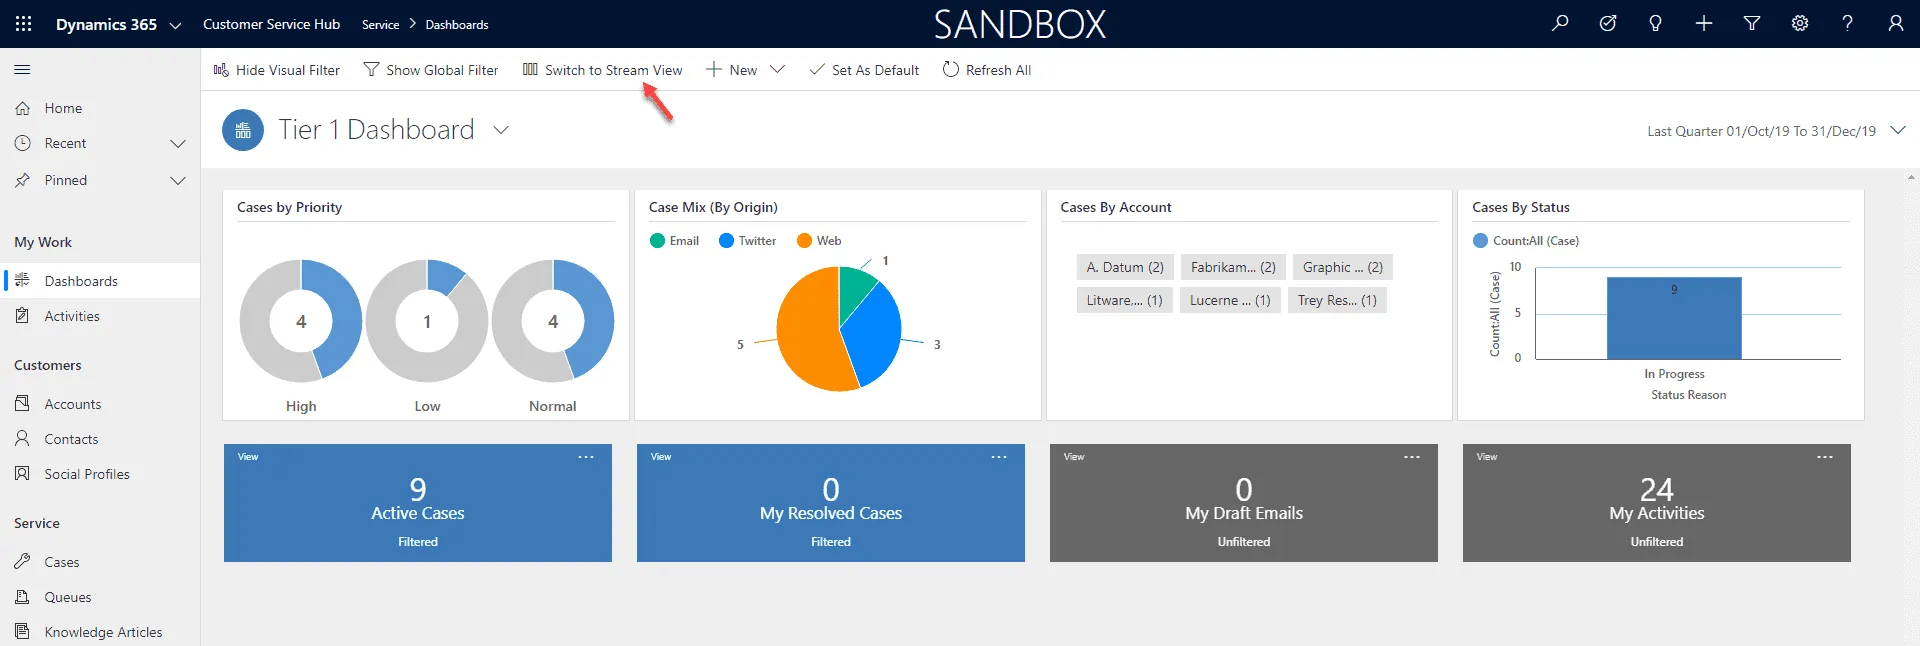
You can switch between tile and stream views.
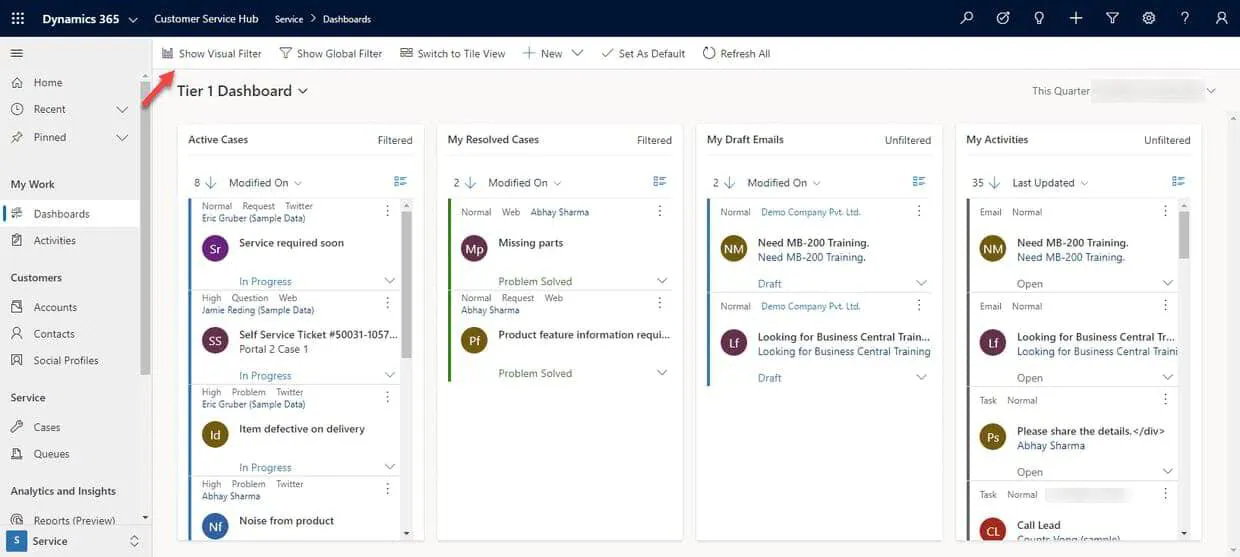
To see the required charts from the dashboard, you need to click Show Visual Filter.
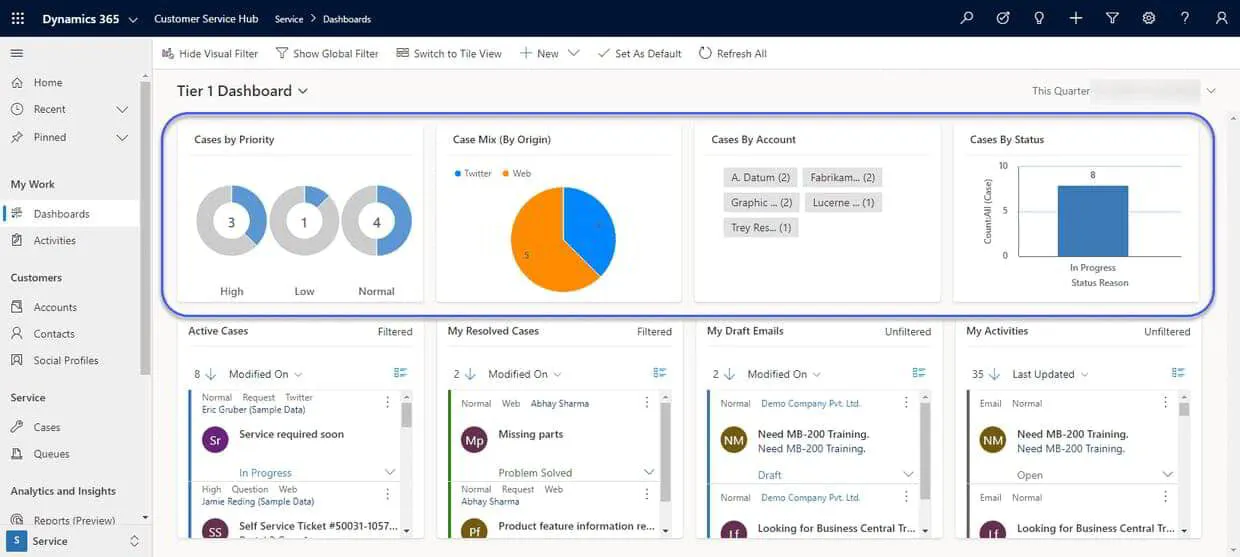
You will see the charts available on the interactive experience dashboard.
To show and save the dashboard filters, click Show Global Filter.
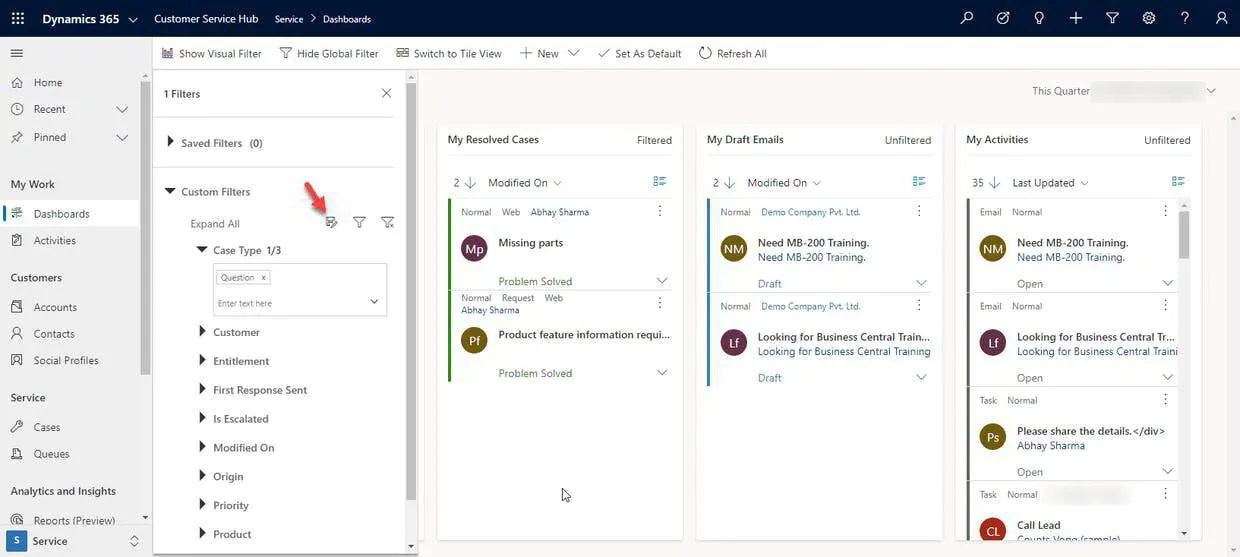
Then you can apply the filters and see data. Also, you can save the filters by clicking the “save as a reusable filter” icon, as shown below.
You need to click Apply Global filter icon (the funnel), which is the middle icon to apply the filter to the dashboard.
In the latest version of Dynamics 365 Sales, all system and custom entities in the unified interface are enabled by default for interactive experience dashboards.
But you may expect questions about the out of the box entities that are enabled for interactive experience dashboards. Learn more here.
So, the following system entities are enabled for interactive dashboards by default (this is just for exam preparation, but things have changed in the latest version):
Multi-stream and single-stream dashboards contain interactive charts that provide a count of relevant records, such as cases by priority or by status. These charts also act as visual filters. The visual filters (interactive charts) are based on multiple entities, and in the single-stream dashboards, the entity in the data stream defines the visual filter entity.
Users can apply additional filtering with a global filter and timeframe filter. The global filter works at a field level on all charts, and also on streams and tiles that are based on the filter entity (you specify the filter entity when you configure the visual filters).